shape
shape

Data Visualization using Tableau


Best Software Training Institute in Coimbatore

  • Home
  • Data Visualization using Tableau
Course Image 40 Hours Special Program

Data Visualization Using Tableau

Master how to understand data, clean data, connect data sources and convert them into useful reports. Our certification course in Data Visualization using Tableau helps for your fast-growing career.
Our comprehensive course is designed to equip you with the skills and knowledge needed to excel in data visualization using Tableau's powerful features.

Premier destination for mastering Tableau in Coimbatore

Our certificate program in Data Visualization using Tableau covers everything you need to know to become proficient in Tableau. Whether you're a beginner or an experienced professional, our course is tailored to meet your needs. From basic concepts to advanced techniques, we'll guide you through every step of the process.

Meet the Growing Demand

In today's data-driven world, the demand for skilled data handling professionals is higher than ever. Organizations across industries are actively seeking individuals who can effectively analyze and present data in a meaningful way. By mastering Tableau, you'll position yourself as a valuable asset in the job market.

What You'll Learn

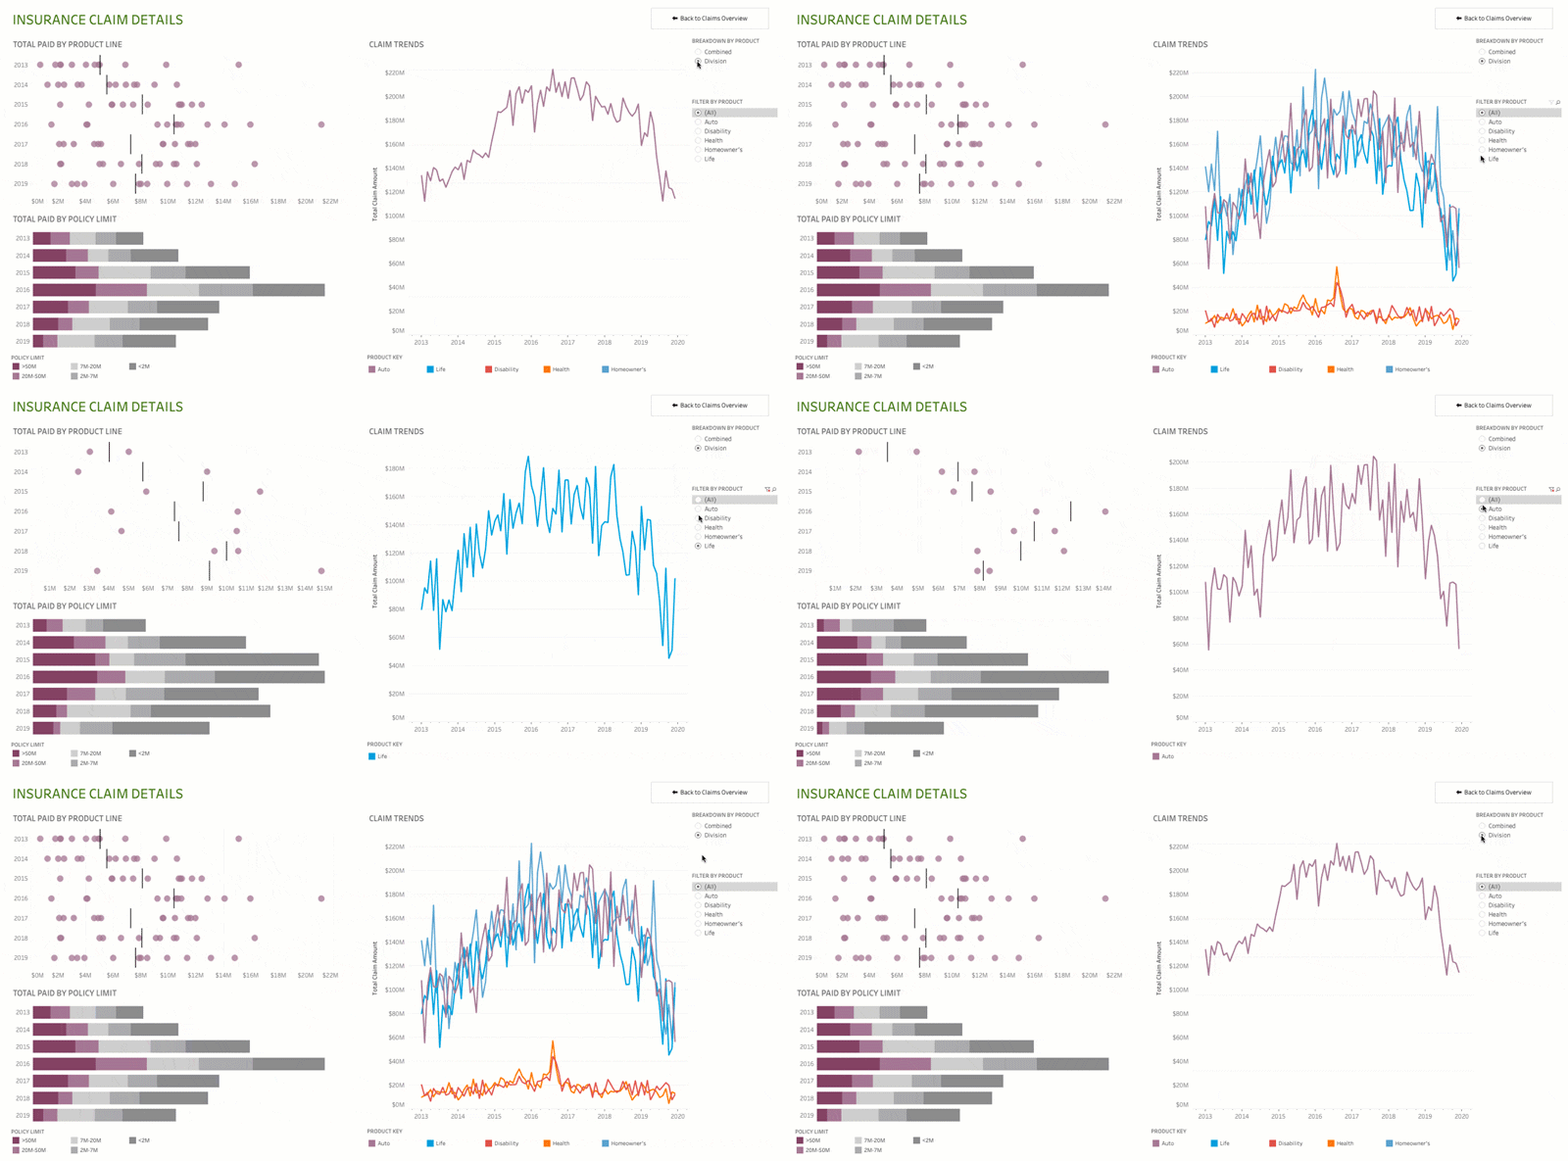
We believe in learning by doing. That's why our course is packed with hands-on exercises and real-world projects that will allow you to apply your newfound skills in practical scenarios. You'll learn how to create interactive dashboards, generate insightful reports, and visualize data like never before.

  • Creating visually stunning dashboards and reports
  • Connecting and manipulating data sources
  • Implementing advanced analytics techniques
  • Designing interactive visualizations
  • Utilizing Tableau's powerful features like filters, forecasting, and trend lines
  • And much more!
Join Us Today

Don't miss out on the opportunity to master Tableau and take your data visualization skills to the next level. Enroll in our certificate program today and unlock your full potential in the world of data analytics.

Data Visualization using Tableau Training Modules

In this module, we’ve covered fundamental and advanced concepts of the data visualization software tool Tableau. Our certificate program in Data visualization using Tableau will teach you to analyze, discover a pattern, convert it into graphics and communicate through data.

  • Data Visualization Introduction and Concepts
  • Tableau Introduction and Tableau Architecture
  • Exploring Data using Tableau
  • Working with Data using Tableau including Data Extraction and Blending
  • Various Charts in Tableau (Basic to Advanced)
  • Eye for Detail - (Tableau Crosstabs), Highlight tables
  • Comparative Analysis - Bar Graphs, Side-By-Side Bars, Circle Views, Heat Map, Bubble Chart
  • Composition Analysis - Pie Chart, Donut Chart, Stacked Bar Graph
  • Trend Analysis - Line Graphs and Area Graphs (Discrete and Continuous)
  • Hierarchical Data Representation - Tree Map
  • Correlation Analysis - Scatter Plot
  • Distribution Analysis - Tableau Histogram, Box and Whisker Plot
  • GeoSpatial Data Representation - Filled Maps, Symbol Maps, Combination Maps, Polygon Maps
  • Relative comparison of 2 Measures - Bullet Graph, Dual Axis Chart, Dual Combination Chart, Blended Axis Chart, Bar in a Bar Chart
  • Pareto Analysis - Pareto Chart
  • Statistical Control Chart
  • Tableau Gantt Chart
  • Hierarchies - Tableau Drill Down and Roll Up Features
  • Sorting - Quick Sort, Sort from Headers, Legends, Axis, Tool Bar; Sort by Fields, Nested Sort
  • Filtering - Dimension Filters, Measure Filters, Date Filters, Tableau Context Filters
  • Groups, Sets and Combined Sets
  • Reference Lines, Bands and Distribution
  • Parameters - Dynamic Parameters, Parameter Actions
  • Forecasting - Exponential Smoothing Technique
  • Data Mining Unsupervised Learning - Clustering
  • Calculated fields in Tableau, Quick Table Calculations, LOD Expressions
  • Tableau Mapping Features
  • Tableau - R Integration
  • Tableau Interactive Dashboards, Dashboard Actions, Stories
  • Tableau Certification Orientation
Author Image

Certificate

Get a certificate and showcase your dedication to your career. Utilize it to differentiate yourself in the industry, get acknowledged in the job market and boost your job profile value. This certificate is your ticket to a skyrocketing in your career.

Tools Covered
Author Image

Krithik Balasubramaniam

Areas of expertise: Data sciences, Machine learning, Business intelligence and Data.
Over 20+ years of industry experience in data science and business intelligence

How We Prepare You for Success
  • Industry expert trainers
  • Dedicated doubt clarification sessions
  • Business-related course curriculum
  • Regular practical assignments
  • Certificate of Excellence upon course completion
  • Dedicated doubt clarification sessions
Faq

Frequently Asked Question?

The Data Visualization Using Tableau course is designed to teach participants how to use Tableau to create interactive and insightful data visualizations. It covers the basics of Tableau, data connection and transformation, advanced visualization techniques, and dashboard creation.

This course is ideal for business analysts, data analysts, data scientists, business intelligence professionals, and anyone interested in learning how to effectively visualize data using Tableau.

Yes, the course includes hands-on lab sessions where participants will work on real-world data sets and create interactive visualizations and dashboards using Tableau.