shape
shape

Data Visualization using Power BI


Best Software Training Institute in Coimbatore

  • Home
  • Data Visualization using Power BI
Course Image 40 Hours Special Program

Data Visualization using Power BI

Data Visualization with Our Power BI Certification Course in Coimbatore

The forefront of data-driven decision-making with our Power BI Certification Course in Coimbatore. In today's fast-paced business environment, the ability to transform raw data into actionable insights is a crucial skill for professionals across industries. Power BI, a powerful data visualization tool, empowers users to unlock the true potential of their data through intuitive dashboards and reports.

What You'll Learn

Our certification program in Data Visualization using Power BI is designed to equip you with the skills and knowledge needed to harness the full capabilities of this powerful tool. Throughout the course, you'll explore advanced concepts such as:

  • Power BI Desktop Layouts
  • DAX Commands, Functions & Formulas
  • Report Creation and Customization
  • Interactive Dashboards Design
Hands-on Learning Experience

Through hands-on exercises and real-world case studies, you'll learn to create customized visuals and dashboards that deliver meaningful insights from vast amounts of data. From sales analysis reports to project management dashboards, you'll gain the skills needed to transform raw data into actionable intelligence.

Who Should Enroll:

This course is tailored for professionals who work with data on a daily basis and want to enhance their analytical capabilities. Whether you're a business analyst, data scientist, or aspiring data professional, our Power BI Certification Course offers a pathway to dive into the realms of Business Intelligence and Data Analytics.

Join Us and Elevate Your Data Visualization Skills

Are you ready to take your data visualization skills to the next level? Enroll in our Power BI Certification Course in Coimbatore and unlock the power of data-driven decision-making. Whether you're looking to advance your career or enhance your analytical capabilities, our course offers the tools and expertise you need to succeed in the dynamic world of data analytics. Join us today and pave the way to a brighter future with Power BI!

Data Visualisation using Power BI Training Modules

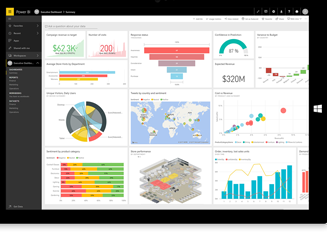
In this module, we’ve covered fundamental and advanced concepts of the data visualization software tool PowerBI. You'll have hands-on experience using Power BI software and learn how to fix, experiment, prepare, and present data easily.

  • Introduction to Power BI
  • Installing Power BI
  • Why Power BI
  • Key Benefits of Power BI
  • The flow of Power BI
  • Components of Power BI
  • The architecture of Power BI
  • Components of Power BI
  • Overview of Power BI Desktop
  • Data sources and connections in Power BI ( Various different DS connections)
  • Query editor in Power BI
  • Using files (excel, pdf, CSV, etc.) as a data source
  • Using SaaS connectors
  • Extracting data from folders, and databases
  • Working with Azure SQL database and database sources
  • Connecting to Analysis Services
  • Other data sources (OData, web, SharePoint etc.)
  • Python & R script in Power BI
  • Why DAX
  • DAX Syntax
  • Data types in DAX
  • Types of calculations
  • DAX tables and Filtering
  • DAX queries
  • DAX Parameters
  • Measures using DAX
  • Formatting data
  • Transformation of data
  • Understanding of Data types
  • Data profiling for data quality check
  • Naming conventions & best practices to consider
  • Working with Parameters
  • Merge Query
  • Append Query
  • Custom columns
  • Conditional columns
  • Replace data from the tables
  • Split columns values
  • Move columns & sorting data
  • M query
  • Supported Chart types in Power BI
  • Map Visualizations
  • Colour palettes in Charts
  • Loading Shapes, text boxes, and images
  • Custom visuals
  • Z-Order
Author Image

Certificate

Get a certificate and showcase your dedication to your career. Utilize it to differentiate yourself in the industry, get acknowledged in the job market and boost your job profile value. This certificate is your ticket to a skyrocketing in your career.

Tools Covered
Author Image

Rajesh Shukla

Areas of expertise: Data sciences, Machine learning, Business intelligence and Data.
Over 20+ years of industry experience in data science and business intelligence

How We Prepare You for Success
  • Industry expert trainers
  • Dedicated doubt clarification sessions
  • Business-related course curriculum
  • Regular practical assignments
  • Certificate of Excellence upon course completion
  • Dedicated doubt clarification sessions
Faq

Frequently Asked Question?

The Data Visualization using Power BI course is designed to teach participants how to use Microsoft Power BI to create compelling data visualizations and interactive dashboards. It covers the fundamentals of Power BI, data modeling, DAX (Data Analysis Expressions), and advanced visualization techniques.

Yes, participants will have access to a variety of online resources, including video tutorials, reference materials, and Power BI templates.

Participants should have a basic understanding of data analysis and familiarity with Excel. No prior experience with Power BI is required.